DimonSmart.TinyBenchmark
1.1.3-beta
 Prefix Reserved
See the version list below for details.
dotnet add package DimonSmart.TinyBenchmark --version 1.1.3-beta
NuGet\Install-Package DimonSmart.TinyBenchmark -Version 1.1.3-beta
<PackageReference Include="DimonSmart.TinyBenchmark" Version="1.1.3-beta" />
paket add DimonSmart.TinyBenchmark --version 1.1.3-beta
#r "nuget: DimonSmart.TinyBenchmark, 1.1.3-beta"
// Install DimonSmart.TinyBenchmark as a Cake Addin
#addin nuget:?package=DimonSmart.TinyBenchmark&version=1.1.3-beta&prerelease

// Install DimonSmart.TinyBenchmark as a Cake Tool
#tool nuget:?package=DimonSmart.TinyBenchmark&version=1.1.3-beta&prerelease
TinyBenchmark
A Simple and User-Friendly Benchmarking Library
TinyBenchmark is a straightforward and user-friendly benchmarking library designed to facilitate a transparent comparison of execution times between two alternative functions. With the ability to parameterize functions using a single argument, TinyBenchmark makes it easy to assess performance differences.
Key Features:
Easy to Use: TinyBenchmark simplifies the process of benchmarking, ensuring you can quickly and effortlessly compare the execution times of different functions.
Parameterization: Easily parametrize functions with a single argument for more versatile testing.
Export Options: Benchmarking results can be exported in various formats, including:
RAW Plain CSV: Generate raw data in CSV format for further analysis.
Aggregate Data: Aggregate raw data for all benchmarking points or selectively for specified points of interest.
Function Comparison Graphs: Visualize performance comparisons between functions within test classes.
TinyBenchmark is the ideal tool for gaining valuable insights into your code's performance. Whether you're a developer looking to optimize your code or simply curious about execution times, TinyBenchmark has you covered.
Usage Example
Test class
using DimonSmart.TinyBenchmark;
namespace DimonSmart.TinyBenchmarkTests;

public class ExampleClassTest
{
    [TinyBenchmarkParameter(1, 5, 10, 15, 20, 25)]
    public int BenchmarkParameter { get; set; }

    [TinyBenchmark]
    public void Function1(int parameter)
    {
        var guid = Guid.NewGuid();
    }

    [TinyBenchmark]
    public void Function2(int parameter)
    {
        for (var i = 0; i < parameter; i++)
        {
            var guid = Guid.NewGuid();
        }
    }
}
Benchmark Runner
public class TinyBenchmarkTestRunnerTest
{
    [Fact]
    public void RunAllBenchmarks()
    {
        TinyBenchmarkRunner
            .Create()
            .Run()
            .WithCsvExporter()
                .SaveRawResults()
            .WithGraphExporter()
                .ExportAllRawGraph()
                .ExportAllRawGraph(AscendingTimes)
                .ExportAllFunctionsCompareGraph();
    }
}
Result examples
Function Comparison Graph:
This graph shows the performance comparison of your functions. The X-axis represents
[TinyBenchmarkParameter(1, 5, 10, 15, 20, 25)],
and the Y-axis represents function execution time. All functions are labeled with their names.

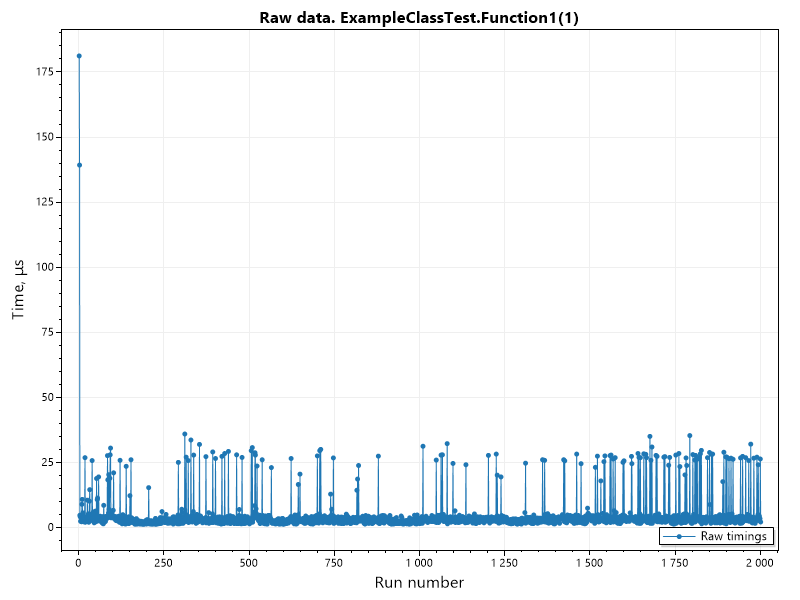
Raw Execution Times
This graph is useful for ensuring that your functions provide stable values over time.
Slightly fluctuated results are okay, but if you see something completely different,
it could indicate the influence of parallel running processes on your measurement process.
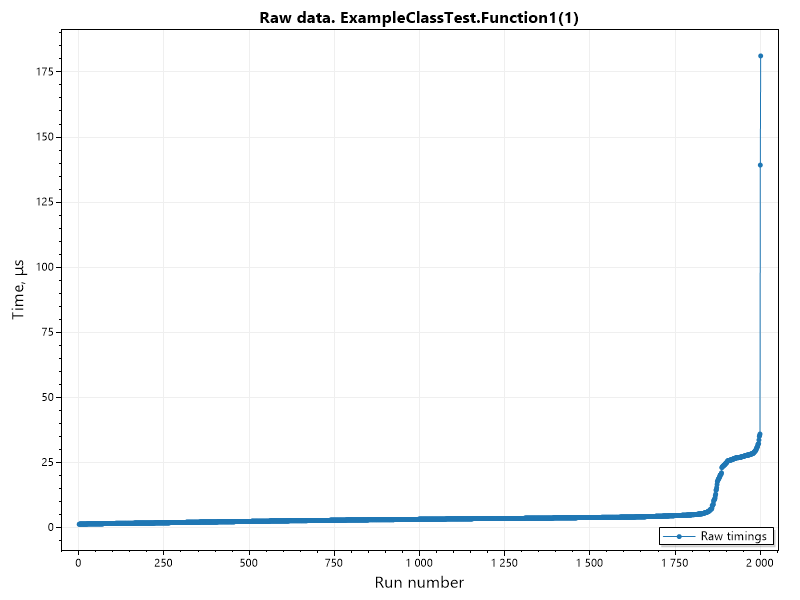
Raw Results (Ordered)
This graph also represents raw timing values but sorted.
A typical graph shape should resemble an almost horizontal line with a sharp rise at the end.
This sharp end corresponds to longer execution times, and the shorter this rising part, the better.
| Product | Versions Compatible and additional computed target framework versions. |
|---|---|
| .NET | net7.0 is compatible. net7.0-android was computed. net7.0-ios was computed. net7.0-maccatalyst was computed. net7.0-macos was computed. net7.0-tvos was computed. net7.0-windows was computed. net8.0 was computed. net8.0-android was computed. net8.0-browser was computed. net8.0-ios was computed. net8.0-maccatalyst was computed. net8.0-macos was computed. net8.0-tvos was computed. net8.0-windows was computed. |
NuGet packages
This package is not used by any NuGet packages.
GitHub repositories
This package is not used by any popular GitHub repositories.
| Version | Downloads | Last updated | |
|---|---|---|---|
| 2.1.0-beta | 65 | 2/18/2024 | |
| 2.0.0-beta | 75 | 2/5/2024 | |
| 1.1.5-beta | 186 | 12/7/2023 | |
| 1.1.4-beta | 108 | 11/28/2023 | |
| 1.1.3-beta | 127 | 11/6/2023 |