NetPro.Prometheus
6.0.16
dotnet add package NetPro.Prometheus --version 6.0.16
NuGet\Install-Package NetPro.Prometheus -Version 6.0.16
This command is intended to be used within the Package Manager Console in Visual Studio, as it uses the NuGet module's version of Install-Package.
<PackageReference Include="NetPro.Prometheus" Version="6.0.16" />
For projects that support PackageReference, copy this XML node into the project file to reference the package.
paket add NetPro.Prometheus --version 6.0.16
The NuGet Team does not provide support for this client. Please contact its maintainers for support.
#r "nuget: NetPro.Prometheus, 6.0.16"
#r directive can be used in F# Interactive and Polyglot Notebooks. Copy this into the interactive tool or source code of the script to reference the package.
// Install NetPro.Prometheus as a Cake Addin
#addin nuget:?package=NetPro.Prometheus&version=6.0.16

// Install NetPro.Prometheus as a Cake Tool
#tool nuget:?package=NetPro.Prometheus&version=6.0.16
The NuGet Team does not provide support for this client. Please contact its maintainers for support.
NetPro.Prometheus使用

Prometheus 监控
- 添加
NetPro.Prometheus引用 - 添加配置 appsetting.json
{
	"MetricEndpointsOptions": {
		"EnvironmentInfoEndpointEnabled": "True",
		"MetricsEndpointEnabled": "True",
		"MetricsTextEndpointEnabled": "True" //是否启用端点
	},
	"MetricsEndpointsHostingOptions": {
		"EnvironmentInfoEndpoint": "/env", //应用环境路径
		"MetricsEndpoint": "/netpro",//监控json文本格式路径
		"MetricsTextEndpoint": "/netpro-text" //监控text文本格式路径
	},
	"MetricsOptions": {
		"Enabled": "True" //是否启用监控
	},
	"MetricsWebTrackingOptions": {
		"ApdexTrackingEnabled": "True",
		"ApdexTSeconds": "0.1",
		"IgnoredHttpStatusCodes": [
			"100"
		],
		"OAuth2TrackingEnabled": "True"
	}
}
无配置时默认启用,按默认配置监控
效果:
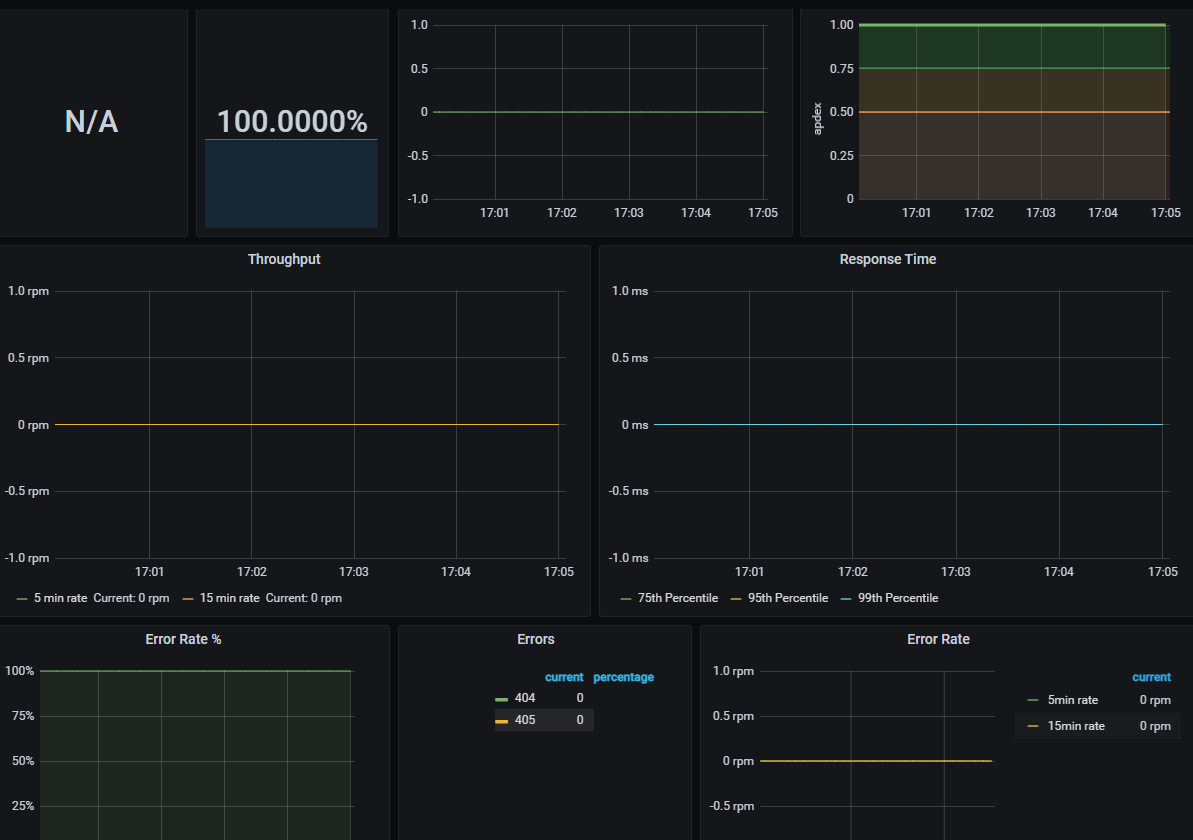
配置Prometheus configuration
garafna Prometheus 面板
{
"__inputs": [
{
"name": "DS_PROMETHEUS",
"label": "Prometheus",
"description": "",
"type": "datasource",
"pluginId": "prometheus",
"pluginName": "Prometheus"
}
],
"__requires": [
{
"type": "grafana",
"id": "grafana",
"name": "Grafana",
"version": "7.0.3"
},
{
"type": "panel",
"id": "grafana-piechart-panel",
"name": "Pie Chart",
"version": "1.5.0"
},
{
"type": "panel",
"id": "graph",
"name": "Graph",
"version": ""
},
{
"type": "datasource",
"id": "prometheus",
"name": "Prometheus",
"version": "1.0.0"
},
{
"type": "panel",
"id": "singlestat",
"name": "Singlestat",
"version": ""
},
{
"type": "panel",
"id": "table-old",
"name": "Table (old)",
"version": ""
}
],
"annotations": {
"list": [
{
"builtIn": 1,
"datasource": "-- Grafana --",
"enable": true,
"hide": true,
"iconColor": "rgba(0, 211, 255, 1)",
"name": "Annotations & Alerts",
"type": "dashboard"
}
]
},
"description": "Dashboard to visualize metrics captured by App Metrics ASP.NET Core Middleware 1.2.0, tested with App.Metrics.Formatters.Prometheus 1.1.0 - http://app-metrics.io/",
"editable": true,
"gnetId": 2204,
"graphTooltip": 1,
"id": null,
"iteration": 1594973499527,
"links": [],
"panels": [
{
"collapsed": false,
"datasource": "${DS_INFLUXDB}",
"gridPos": {
"h": 1,
"w": 24,
"x": 0,
"y": 0
},
"id": 23,
"panels": [],
"repeat": null,
"title": "Overview",
"type": "row"
},
{
"cacheTimeout": null,
"colorBackground": false,
"colorValue": false,
"colors": [
"rgba(245, 54, 54, 0.9)",
"rgba(237, 129, 40, 0.89)",
"rgba(50, 172, 45, 0.97)"
],
"datasource": "$datasource",
"editable": true,
"error": false,
"fieldConfig": {
"defaults": {
"custom": {}
},
"overrides": []
},
"format": "rpm",
"gauge": {
"maxValue": 100,
"minValue": 0,
"show": false,
"thresholdLabels": false,
"thresholdMarkers": true
},
"gridPos": {
"h": 7,
"w": 4,
"x": 0,
"y": 1
},
"id": 8,
"interval": "",
"links": [],
"mappingType": 1,
"mappingTypes": [
{
"name": "value to text",
"value": 1
},
{
"name": "range to text",
"value": 2
}
],
"maxDataPoints": 100,
"nullPointMode": "connected",
"nullText": null,
"postfix": "",
"postfixFontSize": "50%",
"prefix": "",
"prefixFontSize": "50%",
"rangeMaps": [
{
"from": "null",
"text": "N/A",
"to": "null"
}
],
"sparkline": {
"fillColor": "rgba(31, 118, 189, 0.18)",
"full": true,
"lineColor": "rgb(31, 120, 193)",
"show": true
},
"tableColumn": "{app=\"MetricsPrometheusSandboxMvc\", env=\"development\", instance=\"localhost:1111\", job=\"app metrics sandbox\", server=\"DESKTOP-Q8HU0DC\"}",
"targets": [
{
"dsType": "influxdb",
"expr": "rate(application_httprequests_transactions_count{env=\"$environment\",app=\"$application\",server=\"$server\"}[1m])*60",
"groupBy": [
{
"params": [
"$interval"
],
"type": "time"
},
{
"params": [
"null"
],
"type": "fill"
}
],
"intervalFactor": 1,
"measurement": "application.httprequests__transactions",
"metric": "",
"policy": "default",
"refId": "A",
"resultFormat": "time_series",
"select": [
[
{
"params": [
"rate1m"
],
"type": "field"
},
{
"params": [],
"type": "last"
}
]
],
"step": 2,
"tags": [
{
"key": "app",
"operator": "=~",
"value": "/^$application$/"
},
{
"condition": "AND",
"key": "env",
"operator": "=~",
"value": "/^$environment$/"
}
]
}
],
"thresholds": "",
"title": "Throughput",
"type": "singlestat",
"valueFontSize": "80%",
"valueMaps": [
{
"op": "=",
"text": "N/A",
"value": "null"
}
],
"valueName": "current"
},
{
"cacheTimeout": null,
"colorBackground": false,
"colorValue": false,
"colors": [
"rgba(50, 172, 45, 0.97)",
"rgba(237, 129, 40, 0.89)",
"rgba(245, 54, 54, 0.9)"
],
"datasource": "$datasource",
"decimals": 4,
"editable": true,
"error": false,
"fieldConfig": {
"defaults": {
"custom": {}
},
"overrides": []
},
"format": "percent",
"gauge": {
"maxValue": 100,
"minValue": 0,
"show": false,
"thresholdLabels": false,
"thresholdMarkers": true
},
"gridPos": {
"h": 7,
"w": 4,
"x": 4,
"y": 1
},
"id": 6,
"interval": null,
"links": [],
"mappingType": 1,
"mappingTypes": [
{
"name": "value to text",
"value": 1
},
{
"name": "range to text",
"value": 2
}
],
"maxDataPoints": 100,
"nullPointMode": "connected",
"nullText": null,
"postfix": "",
"postfixFontSize": "50%",
"prefix": "",
"prefixFontSize": "50%",
"rangeMaps": [
{
"from": "",
"text": "",
"to": ""
}
],
"sparkline": {
"fillColor": "rgba(31, 118, 189, 0.18)",
"full": true,
"lineColor": "rgb(31, 120, 193)",
"show": true
},
"tableColumn": "application_httprequests_one_minute_error_percentage_rate{app=\"MetricsPrometheusSandboxMvc\", env=\"development\", instance=\"localhost:1111\", job=\"app metrics sandbox\", server=\"DESKTOP-Q8HU0DC\"}",
"targets": [
{
"dsType": "influxdb",
"expr": "application_httprequests_one_minute_error_percentage_rate{env=\"$environment\",app=\"$application\",server=\"$server\"}",
"groupBy": [],
"intervalFactor": 2,
"measurement": "application.httprequests__one_minute_error_percentage_rate",
"policy": "default",
"query": "SELECT \"value\" FROM \"application.httprequests__percentage_error_requests\" WHERE $timeFilter",
"rawQuery": false,
"refId": "A",
"resultFormat": "time_series",
"select": [
[
{
"params": [
"value"
],
"type": "field"
}
]
],
"step": 4,
"tags": [
{
"key": "env",
"operator": "=~",
"value": "/^$environment$/"
},
{
"condition": "AND",
"key": "app",
"operator": "=~",
"value": "/^$application$/"
}
]
}
],
"thresholds": "",
"title": "Error %",
"type": "singlestat",
"valueFontSize": "80%",
"valueMaps": [
{
"op": "=",
"text": "0%",
"value": "null"
}
],
"valueName": "current"
},
{
"aliasColors": {},
"bars": false,
"dashLength": 10,
"dashes": false,
"datasource": "$datasource",
"editable": true,
"error": false,
"fieldConfig": {
"defaults": {
"custom": {}
},
"overrides": []
},
"fill": 2,
"fillGradient": 0,
"gridPos": {
"h": 7,
"w": 8,
"x": 8,
"y": 1
},
"hiddenSeries": false,
"id": 13,
"interval": "$summarize",
"legend": {
"avg": false,
"current": false,
"max": false,
"min": false,
"show": false,
"total": false,
"values": false
},
"lines": true,
"linewidth": 1,
"links": [],
"nullPointMode": "connected",
"options": {
"dataLinks": []
},
"percentage": false,
"pointradius": 5,
"points": false,
"renderer": "flot",
"seriesOverrides": [],
"spaceLength": 10,
"stack": false,
"steppedLine": false,
"targets": [
{
"alias": "",
"dsType": "influxdb",
"expr": "application_httprequests_active{env=\"$environment\",app=\"$application\",server=\"$server\"}",
"groupBy": [
{
"params": [
"$interval"
],
"type": "time"
},
{
"params": [
"null"
],
"type": "fill"
}
],
"intervalFactor": 2,
"measurement": "application.httprequests__active",
"policy": "default",
"refId": "A",
"resultFormat": "time_series",
"select": [
[
{
"params": [
"value"
],
"type": "field"
},
{
"params": [],
"type": "last"
}
]
],
"step": 10,
"tags": [
{
"key": "env",
"operator": "=~",
"value": "/^$environment$/"
},
{
"condition": "AND",
"key": "app",
"operator": "=~",
"value": "/^$application$/"
}
]
}
],
"thresholds": [],
"timeFrom": null,
"timeRegions": [],
"timeShift": null,
"title": "Active Requests",
"tooltip": {
"msResolution": false,
"shared": true,
"sort": 0,
"value_type": "individual"
},
"type": "graph",
"xaxis": {
"buckets": null,
"mode": "time",
"name": null,
"show": true,
"values": []
},
"yaxes": [
{
"format": "short",
"label": null,
"logBase": 1,
"max": null,
"min": null,
"show": true
},
{
"format": "short",
"label": null,
"logBase": 1,
"max": null,
"min": null,
"show": true
}
],
"yaxis": {
"align": false,
"alignLevel": null
}
},
{
"aliasColors": {
"application.httprequests__apdex.last": "#6ED0E0"
},
"bars": false,
"dashLength": 10,
"dashes": false,
"datasource": "$datasource",
"editable": true,
"error": false,
"fieldConfig": {
"defaults": {
"custom": {}
},
"overrides": []
},
"fill": 1,
"fillGradient": 0,
"gridPos": {
"h": 7,
"w": 8,
"x": 16,
"y": 1
},
"height": "",
"hiddenSeries": false,
"id": 7,
"interval": "$summarize",
"legend": {
"avg": false,
"current": false,
"max": false,
"min": false,
"show": false,
"total": false,
"values": false
},
"lines": true,
"linewidth": 3,
"links": [],
"nullPointMode": "connected",
"options": {
"dataLinks": []
},
"percentage": false,
"pointradius": 5,
"points": false,
"renderer": "flot",
"seriesOverrides": [],
"spaceLength": 10,
"stack": false,
"steppedLine": false,
"targets": [
{
"dsType": "influxdb",
"expr": "application_httprequests_apdex{env=\"$environment\",app=\"$application\",server=\"$server\"}",
"groupBy": [
{
"params": [
"$interval"
],
"type": "time"
},
{
"params": [
"null"
],
"type": "fill"
}
],
"interval": "",
"intervalFactor": 2,
"legendFormat": "",
"measurement": "application.httprequests__apdex",
"metric": "application_httprequests_apdex",
"policy": "default",
"refId": "A",
"resultFormat": "time_series",
"select": [
[
{
"params": [
"score"
],
"type": "field"
},
{
"params": [],
"type": "last"
}
]
],
"step": 10,
"tags": [
{
"key": "app",
"operator": "=~",
"value": "/^$application$/"
},
{
"condition": "AND",
"key": "env",
"operator": "=~",
"value": "/^$environment$/"
}
]
}
],
"thresholds": [
{
"$$hashKey": "object:453",
"colorMode": "critical",
"fill": true,
"line": true,
"op": "lt",
"value": 0.5,
"yaxis": "left"
},
{
"$$hashKey": "object:454",
"colorMode": "warning",
"fill": true,
"line": true,
"op": "gt",
"value": 0.5,
"yaxis": "left"
},
{
"$$hashKey": "object:455",
"colorMode": "ok",
"fill": true,
"line": true,
"op": "gt",
"value": 0.75,
"yaxis": "left"
}
],
"timeFrom": null,
"timeRegions": [],
"timeShift": null,
"title": "Apdex score",
"tooltip": {
"msResolution": false,
"shared": true,
"sort": 0,
"value_type": "individual"
},
"type": "graph",
"xaxis": {
"buckets": null,
"mode": "time",
"name": null,
"show": true,
"values": []
},
"yaxes": [
{
"format": "short",
"label": "apdex",
"logBase": 1,
"max": "1",
"min": "0",
"show": true
},
{
"format": "short",
"label": null,
"logBase": 1,
"max": null,
"min": null,
"show": false
}
],
"yaxis": {
"align": false,
"alignLevel": null
}
},
{
"aliasColors": {},
"bars": false,
"dashLength": 10,
"dashes": false,
"datasource": "$datasource",
"editable": true,
"error": false,
"fieldConfig": {
"defaults": {
"custom": {}
},
"overrides": []
},
"fill": 1,
"fillGradient": 0,
"gridPos": {
"h": 10,
"w": 12,
"x": 0,
"y": 8
},
"height": "350",
"hiddenSeries": false,
"id": 1,
"interval": "$summarize",
"legend": {
"avg": false,
"current": true,
"max": false,
"min": false,
"show": true,
"total": false,
"values": true
},
"lines": true,
"linewidth": 1,
"links": [],
"nullPointMode": "connected",
"options": {
"dataLinks": []
},
"percentage": false,
"pointradius": 5,
"points": false,
"renderer": "flot",
"seriesOverrides": [],
"spaceLength": 10,
"stack": false,
"steppedLine": false,
"targets": [
{
"alias": "$col",
"dsType": "influxdb",
"expr": "rate(application_httprequests_transactions_count{env=\"$environment\",app=\"$application\",server=\"$server\"}[1m])*60",
"groupBy": [
{
"params": [
"$interval"
],
"type": "time"
},
{
"params": [
"null"
],
"type": "fill"
}
],
"intervalFactor": 2,
"legendFormat": "1 min rate",
"measurement": "application.httprequests__transactions",
"policy": "default",
"refId": "A",
"resultFormat": "time_series",
"select": [
[
{
"params": [
"rate1m"
],
"type": "field"
},
{
"params": [],
"type": "last"
},
{
"params": [
"1 min rate"
],
"type": "alias"
}
],
[
{
"params": [
"rate5m"
],
"type": "field"
},
{
"params": [],
"type": "last"
},
{
"params": [
"5 min rate"
],
"type": "alias"
}
],
[
{
"params": [
"rate15m"
],
"type": "field"
},
{
"params": [],
"type": "last"
},
{
"params": [
"15 min rate"
],
"type": "alias"
}
]
],
"step": 10,
"tags": [
{
"key": "env",
"operator": "=~",
"value": "/^$environment$/"
},
{
"condition": "AND",
"key": "app",
"operator": "=~",
"value": "/^$application$/"
}
]
},
{
"expr": "rate(application_httprequests_transactions_count{env=\"$environment\",app=\"$application\",server=\"$server\"}[5m])*60",
"intervalFactor": 2,
"legendFormat": "5 min rate",
"refId": "B",
"step": 10
},
{
"expr": "rate(application_httprequests_transactions_count{env=\"$environment\",app=\"$application\",server=\"$server\"}[15m])*60",
"intervalFactor": 2,
"legendFormat": "15 min rate",
"refId": "C",
"step": 10
}
],
"thresholds": [],
"timeFrom": null,
"timeRegions": [],
"timeShift": null,
"title": "Throughput",
"tooltip": {
"msResolution": false,
"shared": true,
"sort": 0,
"value_type": "individual"
},
"type": "graph",
"xaxis": {
"buckets": null,
"mode": "time",
"name": null,
"show": true,
"values": []
},
"yaxes": [
{
"format": "rpm",
"label": null,
"logBase": 1,
"max": null,
"min": null,
"show": true
},
{
"format": "short",
"label": null,
"logBase": 1,
"max": null,
"min": null,
"show": true
}
],
"yaxis": {
"align": false,
"alignLevel": null
}
},
{
"aliasColors": {},
"bars": false,
"dashLength": 10,
"dashes": false,
"datasource": "$datasource",
"editable": true,
"error": false,
"fieldConfig": {
"defaults": {
"custom": {}
},
"overrides": []
},
"fill": 1,
"fillGradient": 0,
"gridPos": {
"h": 10,
"w": 12,
"x": 12,
"y": 8
},
"height": "350",
"hiddenSeries": false,
"id": 2,
"interval": "$summarize",
"legend": {
"alignAsTable": false,
"avg": false,
"current": false,
"max": false,
"min": false,
"rightSide": false,
"show": true,
"total": false,
"values": false
},
"lines": true,
"linewidth": 1,
"links": [],
"nullPointMode": "connected",
"options": {
"dataLinks": []
},
"percentage": false,
"pointradius": 5,
"points": false,
"renderer": "flot",
"seriesOverrides": [],
"spaceLength": 10,
"stack": false,
"steppedLine": false,
"targets": [
{
"alias": "$col",
"dsType": "influxdb",
"expr": "application_httprequests_transactions{env=\"$environment\",app=\"$application\",server=\"$server\",quantile=\"0.75\"}",
"groupBy": [
{
"params": [
"$interval"
],
"type": "time"
},
{
"params": [
"null"
],
"type": "fill"
}
],
"intervalFactor": 2,
"legendFormat": "75th Percentile",
"measurement": "application.httprequests__transactions",
"metric": "",
"policy": "default",
"refId": "A",
"resultFormat": "time_series",
"select": [
[
{
"params": [
"p95"
],
"type": "field"
},
{
"params": [],
"type": "last"
},
{
"params": [
"95th Percentile"
],
"type": "alias"
}
],
[
{
"params": [
"p98"
],
"type": "field"
},
{
"params": [],
"type": "last"
},
{
"params": [
"98th Percentile"
],
"type": "alias"
}
],
[
{
"params": [
"p99"
],
"type": "field"
},
{
"params": [],
"type": "last"
},
{
"params": [
"99th Percentile"
],
"type": "alias"
}
]
],
"step": 10,
"tags": [
{
"key": "env",
"operator": "=~",
"value": "/^$environment$/"
},
{
"condition": "AND",
"key": "app",
"operator": "=~",
"value": "/^$application$/"
}
]
},
{
"expr": "application_httprequests_transactions{env=\"$environment\",app=\"$application\",server=\"$server\",quantile=\"0.95\"}",
"intervalFactor": 2,
"legendFormat": "95th Percentile",
"refId": "B",
"step": 10
},
{
"expr": "application_httprequests_transactions{env=\"$environment\",app=\"$application\",server=\"$server\",quantile=\"0.99\"}",
"intervalFactor": 2,
"legendFormat": "99th Percentile",
"refId": "C",
"step": 10
}
],
"thresholds": [],
"timeFrom": null,
"timeRegions": [],
"timeShift": null,
"title": "Response Time",
"tooltip": {
"msResolution": false,
"shared": true,
"sort": 0,
"value_type": "individual"
},
"type": "graph",
"xaxis": {
"buckets": null,
"mode": "time",
"name": null,
"show": true,
"values": []
},
"yaxes": [
{
"format": "ms",
"label": null,
"logBase": 1,
"max": null,
"min": null,
"show": true
},
{
"format": "short",
"label": null,
"logBase": 1,
"max": null,
"min": null,
"show": true
}
],
"yaxis": {
"align": false,
"alignLevel": null
}
},
{
"aliasColors": {},
"bars": false,
"dashLength": 10,
"dashes": false,
"datasource": "$datasource",
"editable": true,
"error": false,
"fieldConfig": {
"defaults": {
"custom": {}
},
"overrides": []
},
"fill": 1,
"fillGradient": 0,
"gridPos": {
"h": 7,
"w": 8,
"x": 0,
"y": 18
},
"height": "",
"hiddenSeries": false,
"id": 9,
"interval": "$summarize",
"legend": {
"alignAsTable": true,
"avg": false,
"current": true,
"max": false,
"min": false,
"rightSide": true,
"show": false,
"total": false,
"values": true
},
"lines": true,
"linewidth": 1,
"links": [],
"nullPointMode": "connected",
"options": {
"dataLinks": []
},
"percentage": false,
"pointradius": 5,
"points": false,
"renderer": "flot",
"seriesOverrides": [],
"spaceLength": 10,
"stack": false,
"steppedLine": false,
"targets": [
{
"alias": "",
"dsType": "influxdb",
"expr": "application_httprequests_one_minute_error_percentage_rate{env=\"$environment\",app=\"$application\",server=\"$server\"}",
"groupBy": [
{
"params": [
"$interval"
],
"type": "time"
},
{
"params": [
"null"
],
"type": "fill"
}
],
"intervalFactor": 2,
"measurement": "application.httprequests__one_minute_error_percentage_rate",
"policy": "default",
"refId": "A",
"resultFormat": "time_series",
"select": [
[
{
"params": [
"value"
],
"type": "field"
},
{
"params": [],
"type": "last"
}
]
],
"step": 10,
"tags": [
{
"key": "app",
"operator": "=~",
"value": "/^$application$/"
},
{
"condition": "AND",
"key": "env",
"operator": "=~",
"value": "/^$environment$/"
}
]
}
],
"thresholds": [],
"timeFrom": null,
"timeRegions": [],
"timeShift": null,
"title": "Error Rate %",
"tooltip": {
"msResolution": false,
"shared": true,
"sort": 0,
"value_type": "individual"
},
"type": "graph",
"xaxis": {
"buckets": null,
"mode": "time",
"name": null,
"show": true,
"values": []
},
"yaxes": [
{
"format": "percent",
"label": null,
"logBase": 1,
"max": "100",
"min": "0",
"show": true
},
{
"format": "short",
"label": null,
"logBase": 1,
"max": null,
"min": null,
"show": true
}
],
"yaxis": {
"align": false,
"alignLevel": null
}
},
{
"aliasColors": {},
"breakPoint": "50%",
"cacheTimeout": null,
"combine": {
"label": "Others",
"threshold": 0
},
"datasource": "$datasource",
"editable": true,
"error": false,
"fieldConfig": {
"defaults": {
"custom": {}
},
"overrides": []
},
"fontSize": "80%",
"format": "short",
"gridPos": {
"h": 7,
"w": 6,
"x": 8,
"y": 18
},
"height": "250px",
"id": 4,
"interval": "",
"legend": {
"percentage": true,
"show": true,
"sort": null,
"sortDesc": null,
"values": true
},
"legendType": "Right side",
"links": [],
"maxDataPoints": 3,
"nullPointMode": "connected",
"pieType": "pie",
"strokeWidth": 1,
"targets": [
{
"alias": "$tag_http_status_code",
"dsType": "influxdb",
"expr": "application_httprequests_errors{env=\"$environment\",app=\"$application\",server=\"$server\"}",
"groupBy": [
{
"params": [
"http_status_code"
],
"type": "tag"
}
],
"interval": "",
"intervalFactor": 2,
"legendFormat": "{{http_status_code}}",
"measurement": "application.httprequests__errors",
"policy": "default",
"refId": "A",
"resultFormat": "time_series",
"select": [
[
{
"params": [
"value"
],
"type": "field"
},
{
"params": [],
"type": "sum"
}
]
],
"step": 240,
"tags": [
{
"key": "app",
"operator": "=~",
"value": "/^$application$/"
},
{
"condition": "AND",
"key": "env",
"operator": "=~",
"value": "/^$environment$/"
}
]
}
],
"title": "Errors",
"type": "grafana-piechart-panel",
"valueName": "current"
},
{
"aliasColors": {},
"bars": false,
"dashLength": 10,
"dashes": false,
"datasource": "$datasource",
"decimals": 2,
"editable": true,
"error": false,
"fieldConfig": {
"defaults": {
"custom": {}
},
"overrides": []
},
"fill": 1,
"fillGradient": 0,
"gridPos": {
"h": 7,
"w": 10,
"x": 14,
"y": 18
},
"height": "250px",
"hiddenSeries": false,
"id": 3,
"interval": "$summarize",
"legend": {
"alignAsTable": true,
"avg": false,
"current": true,
"max": false,
"min": false,
"rightSide": true,
"show": true,
"total": false,
"values": true
},
"lines": true,
"linewidth": 1,
"links": [],
"nullPointMode": "connected",
"options": {
"dataLinks": []
},
"percentage": false,
"pointradius": 5,
"points": false,
"renderer": "flot",
"seriesOverrides": [],
"spaceLength": 10,
"stack": false,
"steppedLine": false,
"targets": [
{
"alias": "$col",
"dsType": "influxdb",
"expr": "rate(application_httprequests_error_rate_total[1m])*60",
"groupBy": [
{
"params": [
"$interval"
],
"type": "time"
},
{
"params": [
"null"
],
"type": "fill"
}
],
"intervalFactor": 2,
"legendFormat": "1min rate",
"measurement": "application.httprequests__error_rate",
"policy": "default",
"refId": "A",
"resultFormat": "time_series",
"select": [
[
{
"params": [
"rate1m"
],
"type": "field"
},
{
"params": [],
"type": "last"
},
{
"params": [
"1min rate"
],
"type": "alias"
}
],
[
{
"params": [
"rate5m"
],
"type": "field"
},
{
"params": [],
"type": "last"
},
{
"params": [
"5min rate"
],
"type": "alias"
}
],
[
{
"params": [
"rate15m"
],
"type": "field"
},
{
"params": [],
"type": "last"
},
{
"params": [
"15min rate"
],
"type": "alias"
}
]
],
"step": 10,
"tags": [
{
"key": "app",
"operator": "=~",
"value": "/^$application$/"
},
{
"condition": "AND",
"key": "env",
"operator": "=~",
"value": "/^$environment$/"
}
]
},
{
"expr": "rate(application_httprequests_error_rate_total[5m])*60",
"intervalFactor": 2,
"legendFormat": "5min rate",
"refId": "B",
"step": 10
},
{
"expr": "rate(application_httprequests_error_rate_total[15m])*60",
"intervalFactor": 2,
"legendFormat": "15min rate",
"refId": "C",
"step": 10
}
],
"thresholds": [],
"timeFrom": null,
"timeRegions": [],
"timeShift": null,
"title": "Error Rate",
"tooltip": {
"msResolution": false,
"shared": true,
"sort": 2,
"value_type": "individual"
},
"type": "graph",
"xaxis": {
"buckets": null,
"mode": "time",
"name": null,
"show": true,
"values": []
},
"yaxes": [
{
"format": "rpm",
"label": null,
"logBase": 1,
"max": null,
"min": null,
"show": true
},
{
"format": "short",
"label": null,
"logBase": 1,
"max": null,
"min": null,
"show": true
}
],
"yaxis": {
"align": false,
"alignLevel": null
}
},
{
"collapsed": false,
"datasource": "${DS_INFLUXDB}",
"gridPos": {
"h": 1,
"w": 24,
"x": 0,
"y": 25
},
"id": 24,
"panels": [],
"repeat": null,
"title": "Endpoints",
"type": "row"
},
{
"aliasColors": {},
"bars": false,
"dashLength": 10,
"dashes": false,
"datasource": "$datasource",
"editable": true,
"error": false,
"fieldConfig": {
"defaults": {
"custom": {}
},
"overrides": []
},
"fill": 1,
"fillGradient": 0,
"gridPos": {
"h": 10,
"w": 12,
"x": 0,
"y": 26
},
"height": "350",
"hiddenSeries": false,
"id": 16,
"interval": "$summarize",
"legend": {
"alignAsTable": true,
"avg": false,
"current": false,
"max": false,
"min": false,
"rightSide": true,
"show": true,
"sort": "current",
"sortDesc": true,
"total": false,
"values": false
},
"lines": true,
"linewidth": 1,
"links": [],
"nullPointMode": "connected",
"options": {
"dataLinks": []
},
"percentage": false,
"pointradius": 5,
"points": false,
"renderer": "flot",
"seriesOverrides": [],
"spaceLength": 10,
"stack": true,
"steppedLine": false,
"targets": [
{
"alias": "$tag_route",
"dsType": "influxdb",
"expr": "rate(application_httprequests_transactions_per_endpoint_count{env=\"$environment\",app=\"$application\",server=\"$server\"}[1m])*60",
"groupBy": [
{
"params": [
"$interval"
],
"type": "time"
},
{
"params": [
"route"
],
"type": "tag"
},
{
"params": [
"null"
],
"type": "fill"
}
],
"intervalFactor": 2,
"legendFormat": "{{route}}",
"measurement": "application.httprequests__transactions_per_endpoint",
"policy": "default",
"refId": "A",
"resultFormat": "time_series",
"select": [
[
{
"params": [
"rate1m"
],
"type": "field"
},
{
"params": [],
"type": "last"
}
]
],
"step": 10,
"tags": [
{
"key": "env",
"operator": "=~",
"value": "/^$environment$/"
},
{
"condition": "AND",
"key": "app",
"operator": "=~",
"value": "/^$application$/"
}
]
}
],
"thresholds": [],
"timeFrom": null,
"timeRegions": [],
"timeShift": null,
"title": "Throughput / Endpoint",
"tooltip": {
"msResolution": false,
"shared": true,
"sort": 2,
"value_type": "individual"
},
"type": "graph",
"xaxis": {
"buckets": null,
"mode": "time",
"name": null,
"show": true,
"values": []
},
"yaxes": [
{
"format": "rpm",
"label": null,
"logBase": 1,
"max": null,
"min": null,
"show": true
},
{
"format": "short",
"label": null,
"logBase": 1,
"max": null,
"min": null,
"show": true
}
],
"yaxis": {
"align": false,
"alignLevel": null
}
},
{
"aliasColors": {},
"bars": false,
"dashLength": 10,
"dashes": false,
"datasource": "$datasource",
"editable": true,
"error": false,
"fieldConfig": {
"defaults": {
"custom": {}
},
"overrides": []
},
"fill": 1,
"fillGradient": 0,
"gridPos": {
"h": 10,
"w": 12,
"x": 12,
"y": 26
},
"height": "350",
"hiddenSeries": false,
"id": 17,
"interval": "$summarize",
"legend": {
"alignAsTable": true,
"avg": false,
"current": false,
"max": false,
"min": false,
"rightSide": true,
"show": true,
"total": false,
"values": false
},
"lines": true,
"linewidth": 1,
"links": [],
"nullPointMode": "connected",
"options": {
"dataLinks": []
},
"percentage": false,
"pointradius": 5,
"points": false,
"renderer": "flot",
"seriesOverrides": [],
"spaceLength": 10,
"stack": false,
"steppedLine": false,
"targets": [
{
"alias": "$tag_route",
"dsType": "influxdb",
"expr": "application_httprequests_transactions_per_endpoint{env=\"$environment\",app=\"$application\",server=\"$server\",quantile=\"0.95\"}",
"groupBy": [
{
"params": [
"$interval"
],
"type": "time"
},
{
"params": [
"route"
],
"type": "tag"
},
{
"params": [
"null"
],
"type": "fill"
}
],
"intervalFactor": 2,
"legendFormat": "{{route}}",
"measurement": "application.httprequests__transactions_per_endpoint",
"policy": "default",
"refId": "A",
"resultFormat": "time_series",
"select": [
[
{
"params": [
"p95"
],
"type": "field"
},
{
"params": [],
"type": "last"
},
{
"params": [
"95th Percentile"
],
"type": "alias"
}
]
],
"step": 10,
"tags": [
{
"key": "env",
"operator": "=~",
"value": "/^$environment$/"
},
{
"condition": "AND",
"key": "app",
"operator": "=~",
"value": "/^$application$/"
}
]
}
],
"thresholds": [],
"timeFrom": null,
"timeRegions": [],
"timeShift": null,
"title": "Response Time / Endpoint",
"tooltip": {
"msResolution": false,
"shared": true,
"sort": 0,
"value_type": "individual"
},
"type": "graph",
"xaxis": {
"buckets": null,
"mode": "time",
"name": null,
"show": true,
"values": []
},
"yaxes": [
{
"format": "ms",
"label": null,
"logBase": 1,
"max": null,
"min": null,
"show": true
},
{
"format": "short",
"label": null,
"logBase": 1,
"max": null,
"min": null,
"show": true
}
],
"yaxis": {
"align": false,
"alignLevel": null
}
},
{
"columns": [
{
"text": "Current",
"value": "current"
}
],
"datasource": "$datasource",
"editable": true,
"error": false,
"fieldConfig": {
"defaults": {
"custom": {}
},
"overrides": []
},
"filterNull": false,
"fontSize": "100%",
"gridPos": {
"h": 8,
"w": 8,
"x": 0,
"y": 36
},
"id": 10,
"interval": "",
"links": [],
"pageSize": null,
"scroll": true,
"showHeader": true,
"sort": {
"col": 1,
"desc": true
},
"styles": [
{
"align": "auto",
"dateFormat": "YYYY-MM-DD HH:mm:ss",
"pattern": "Time",
"type": "date"
},
{
"align": "auto",
"colorMode": null,
"colors": [
"rgba(245, 54, 54, 0.9)",
"rgba(237, 129, 40, 0.89)",
"rgba(50, 172, 45, 0.97)"
],
"decimals": 2,
"pattern": "/.*/",
"thresholds": [],
"type": "number",
"unit": "ms"
}
],
"targets": [
{
"alias": "$tag_route",
"dsType": "influxdb",
"expr": "application_httprequests_transactions_per_endpoint{env=\"$environment\",app=\"$application\",server=\"$server\",quantile=\"0.95\"}",
"groupBy": [
{
"params": [
"$interval"
],
"type": "time"
},
{
"params": [
"route"
],
"type": "tag"
},
{
"params": [
"null"
],
"type": "fill"
}
],
"intervalFactor": 2,
"legendFormat": "{{route}}",
"measurement": "application.httprequests__transactions_per_endpoint",
"policy": "default",
"refId": "A",
"resultFormat": "time_series",
"select": [
[
{
"params": [
"p95"
],
"type": "field"
},
{
"params": [],
"type": "last"
}
]
],
"step": 2,
"tags": [
{
"key": "env",
"operator": "=~",
"value": "/^$environment$/"
},
{
"condition": "AND",
"key": "app",
"operator": "=~",
"value": "/^$application$/"
}
]
}
],
"title": "Response Times / Endpoint",
"transform": "timeseries_aggregations",
"type": "table-old"
},
{
"columns": [
{
"text": "Current",
"value": "current"
}
],
"datasource": "$datasource",
"editable": true,
"error": false,
"fieldConfig": {
"defaults": {
"custom": {}
},
"overrides": []
},
"filterNull": false,
"fontSize": "100%",
"gridPos": {
"h": 8,
"w": 8,
"x": 8,
"y": 36
},
"id": 11,
"interval": "",
"links": [],
"pageSize": null,
"scroll": true,
"showHeader": true,
"sort": {
"col": null,
"desc": false
},
"styles": [
{
"align": "auto",
"dateFormat": "YYYY-MM-DD HH:mm:ss",
"pattern": "Time",
"type": "date"
},
{
"align": "auto",
"colorMode": null,
"colors": [
"rgba(245, 54, 54, 0.9)",
"rgba(237, 129, 40, 0.89)",
"rgba(50, 172, 45, 0.97)"
],
"decimals": 0,
"pattern": "/.*/",
"thresholds": [],
"type": "number",
"unit": "percent"
}
],
"targets": [
{
"alias": "$tag_route",
"dsType": "influxdb",
"expr": "application_httprequests_one_minute_error_percentage_rate_per_endpoint{env=\"$environment\",app=\"$application\",server=\"$server\"}",
"groupBy": [
{
"params": [
"$interval"
],
"type": "time"
},
{
"params": [
"route"
],
"type": "tag"
},
{
"params": [
"null"
],
"type": "fill"
}
],
"intervalFactor": 2,
"legendFormat": "{{route}}",
"measurement": "application.httprequests__one_minute_error_percentage_rate_per_endpoint",
"policy": "default",
"refId": "A",
"resultFormat": "time_series",
"select": [
[
{
"params": [
"value"
],
"type": "field"
},
{
"params": [],
"type": "last"
}
]
],
"step": 2,
"tags": [
{
"key": "app",
"operator": "=~",
"value": "/^$application$/"
},
{
"condition": "AND",
"key": "env",
"operator": "=~",
"value": "/^$environment$/"
}
]
}
],
"title": "Error Request Percentage / Endpoint",
"transform": "timeseries_aggregations",
"type": "table-old"
},
{
"columns": [
{
"text": "Current",
"value": "current"
}
],
"datasource": "$datasource",
"editable": true,
"error": false,
"fieldConfig": {
"defaults": {
"custom": {}
},
"overrides": []
},
"filterNull": false,
"fontSize": "100%",
"gridPos": {
"h": 8,
"w": 8,
"x": 16,
"y": 36
},
"id": 12,
"interval": "",
"links": [],
"pageSize": null,
"scroll": true,
"showHeader": true,
"sort": {
"col": 1,
"desc": true
},
"styles": [
{
"align": "auto",
"dateFormat": "YYYY-MM-DD HH:mm:ss",
"pattern": "Time",
"type": "date"
},
{
"align": "auto",
"colorMode": null,
"colors": [
"rgba(245, 54, 54, 0.9)",
"rgba(237, 129, 40, 0.89)",
"rgba(50, 172, 45, 0.97)"
],
"decimals": 2,
"pattern": "/.*/",
"thresholds": [],
"type": "number",
"unit": "rpm"
}
],
"targets": [
{
"alias": "$tag_route",
"dsType": "influxdb",
"expr": "rate(application_httprequests_transactions_per_endpoint_count{env=\"$environment\",app=\"$application\",server=\"$server\"}[1m])*60",
"groupBy": [
{
"params": [
"$interval"
],
"type": "time"
},
{
"params": [
"route"
],
"type": "tag"
},
{
"params": [
"null"
],
"type": "fill"
}
],
"intervalFactor": 2,
"legendFormat": "{{route}}",
"measurement": "application.httprequests__transactions_per_endpoint",
"policy": "default",
"refId": "A",
"resultFormat": "time_series",
"select": [
[
{
"params": [
"rate1m"
],
"type": "field"
},
{
"params": [],
"type": "last"
}
]
],
"step": 2,
"tags": [
{
"key": "env",
"operator": "=~",
"value": "/^$environment$/"
},
{
"condition": "AND",
"key": "app",
"operator": "=~",
"value": "/^$application$/"
}
]
}
],
"title": "Throughput / Endpoint",
"transform": "timeseries_aggregations",
"type": "table-old"
},
{
"collapsed": false,
"datasource": "${DS_INFLUXDB}",
"gridPos": {
"h": 1,
"w": 24,
"x": 0,
"y": 44
},
"id": 26,
"panels": [],
"repeat": null,
"title": "PUT & POST Request Size",
"type": "row"
},
{
"aliasColors": {},
"bars": false,
"dashLength": 10,
"dashes": false,
"datasource": "$datasource",
"editable": true,
"error": false,
"fieldConfig": {
"defaults": {
"custom": {}
},
"overrides": []
},
"fill": 1,
"fillGradient": 0,
"gridPos": {
"h": 8,
"w": 12,
"x": 0,
"y": 45
},
"hiddenSeries": false,
"id": 14,
"interval": "$summarize",
"legend": {
"alignAsTable": true,
"avg": false,
"current": true,
"hideEmpty": false,
"max": false,
"min": false,
"rightSide": true,
"show": true,
"total": false,
"values": true
},
"lines": true,
"linewidth": 1,
"links": [],
"nullPointMode": "connected",
"options": {
"dataLinks": []
},
"percentage": false,
"pointradius": 5,
"points": false,
"renderer": "flot",
"seriesOverrides": [],
"spaceLength": 10,
"stack": false,
"steppedLine": false,
"targets": [
{
"alias": "$col",
"dsType": "influxdb",
"expr": "application_httprequests_post_size{env=\"$environment\",app=\"$application\",server=\"$server\",quantile=\"0.75\"}",
"groupBy": [
{
"params": [
"$interval"
],
"type": "time"
},
{
"params": [
"null"
],
"type": "fill"
}
],
"intervalFactor": 2,
"legendFormat": "75th Percentile",
"measurement": "application.httprequests__post_size",
"policy": "default",
"refId": "A",
"resultFormat": "time_series",
"select": [
[
{
"params": [
"p95"
],
"type": "field"
},
{
"params": [],
"type": "last"
},
{
"params": [
"95th percentile"
],
"type": "alias"
}
],
[
{
"params": [
"p98"
],
"type": "field"
},
{
"params": [],
"type": "last"
},
{
"params": [
"98th percentile"
],
"type": "alias"
}
],
[
{
"params": [
"p99"
],
"type": "field"
},
{
"params": [],
"type": "last"
},
{
"params": [
"99th percentile"
],
"type": "alias"
}
],
[
{
"params": [
"last"
],
"type": "field"
},
{
"params": [],
"type": "median"
},
{
"params": [
"median"
],
"type": "alias"
}
]
],
"step": 10,
"tags": [
{
"key": "app",
"operator": "=~",
"value": "/^$application$/"
},
{
"condition": "AND",
"key": "env",
"operator": "=~",
"value": "/^$environment$/"
}
]
},
{
"expr": "application_httprequests_post_size{env=\"$environment\",app=\"$application\",server=\"$server\",quantile=\"0.95\"}",
"intervalFactor": 2,
"legendFormat": "95th Percentile",
"refId": "B",
"step": 10
},
{
"expr": "application_httprequests_post_size{env=\"$environment\",app=\"$application\",server=\"$server\",quantile=\"0.99\"}",
"intervalFactor": 2,
"legendFormat": "99th Percentile",
"refId": "C",
"step": 10
}
],
"thresholds": [],
"timeFrom": null,
"timeRegions": [],
"timeShift": null,
"title": "Post Request Size",
"tooltip": {
"msResolution": false,
"shared": true,
"sort": 0,
"value_type": "individual"
},
"type": "graph",
"xaxis": {
"buckets": null,
"mode": "time",
"name": null,
"show": true,
"values": []
},
"yaxes": [
{
"format": "decbytes",
"label": null,
"logBase": 1,
"max": null,
"min": null,
"show": true
},
{
"format": "short",
"label": null,
"logBase": 1,
"max": null,
"min": null,
"show": true
}
],
"yaxis": {
"align": false,
"alignLevel": null
}
},
{
"aliasColors": {},
"bars": false,
"dashLength": 10,
"dashes": false,
"datasource": "$datasource",
"editable": true,
"error": false,
"fieldConfig": {
"defaults": {
"custom": {}
},
"overrides": []
},
"fill": 1,
"fillGradient": 0,
"gridPos": {
"h": 8,
"w": 12,
"x": 12,
"y": 45
},
"hiddenSeries": false,
"id": 15,
"interval": "$summarize",
"legend": {
"alignAsTable": true,
"avg": false,
"current": true,
"max": false,
"min": false,
"rightSide": true,
"show": true,
"total": false,
"values": true
},
"lines": true,
"linewidth": 1,
"links": [],
"nullPointMode": "connected",
"options": {
"dataLinks": []
},
"percentage": false,
"pointradius": 5,
"points": false,
"renderer": "flot",
"seriesOverrides": [],
"spaceLength": 10,
"stack": false,
"steppedLine": false,
"targets": [
{
"alias": "$col",
"dsType": "influxdb",
"expr": "application_httprequests_put_size{env=\"$environment\",app=\"$application\",server=\"$server\",quantile=\"0.75\"}",
"groupBy": [
{
"params": [
"$interval"
],
"type": "time"
},
{
"params": [
"null"
],
"type": "fill"
}
],
"intervalFactor": 2,
"legendFormat": "75th Percentile",
"measurement": "application.httprequests__put_size",
"policy": "default",
"refId": "A",
"resultFormat": "time_series",
"select": [
[
{
"params": [
"p95"
],
"type": "field"
},
{
"params": [],
"type": "last"
},
{
"params": [
"95th percentile"
],
"type": "alias"
}
],
[
{
"params": [
"p98"
],
"type": "field"
},
{
"params": [],
"type": "last"
},
{
"params": [
"98th percentile"
],
"type": "alias"
}
],
[
{
"params": [
"p99"
],
"type": "field"
},
{
"params": [],
"type": "last"
},
{
"params": [
"99th percentile"
],
"type": "alias"
}
],
[
{
"params": [
"median"
],
"type": "field"
},
{
"params": [],
"type": "median"
},
{
"params": [
"median"
],
"type": "alias"
}
]
],
"step": 10,
"tags": [
{
"key": "app",
"operator": "=~",
"value": "/^$application$/"
},
{
"condition": "AND",
"key": "env",
"operator": "=~",
"value": "/^$environment$/"
}
]
},
{
"expr": "application_httprequests_put_size{env=\"$environment\",app=\"$application\",server=\"$server\",quantile=\"0.95\"}",
"intervalFactor": 2,
"legendFormat": "95th Percentile",
"refId": "B",
"step": 10
},
{
"expr": "application_httprequests_put_size{env=\"$environment\",app=\"$application\",server=\"$server\",quantile=\"0.99\"}",
"intervalFactor": 2,
"legendFormat": "99th Percentile",
"refId": "C",
"step": 10
}
],
"thresholds": [],
"timeFrom": null,
"timeRegions": [],
"timeShift": null,
"title": "Put Request Size",
"tooltip": {
"msResolution": false,
"shared": true,
"sort": 0,
"value_type": "individual"
},
"type": "graph",
"xaxis": {
"buckets": null,
"mode": "time",
"name": null,
"show": true,
"values": []
},
"yaxes": [
{
"format": "bytes",
"label": null,
"logBase": 1,
"max": null,
"min": null,
"show": true
},
{
"format": "short",
"label": null,
"logBase": 1,
"max": null,
"min": null,
"show": true
}
],
"yaxis": {
"align": false,
"alignLevel": null
}
}
],
"refresh": "5s",
"schemaVersion": 25,
"style": "dark",
"tags": [
"prometheus"
],
"templating": {
"list": [
{
"allValue": null,
"current": {},
"datasource": "$datasource",
"definition": "",
"hide": 0,
"includeAll": false,
"label": null,
"multi": false,
"name": "environment",
"options": [],
"query": "label_values(env)",
"refresh": 1,
"regex": "",
"skipUrlSync": false,
"sort": 1,
"tagValuesQuery": null,
"tags": [],
"tagsQuery": null,
"type": "query",
"useTags": false
},
{
"allValue": null,
"current": {},
"datasource": "$datasource",
"definition": "",
"hide": 0,
"includeAll": false,
"label": null,
"multi": false,
"name": "application",
"options": [],
"query": "label_values(app)",
"refresh": 1,
"regex": "",
"skipUrlSync": false,
"sort": 1,
"tagValuesQuery": null,
"tags": [],
"tagsQuery": null,
"type": "query",
"useTags": false
},
{
"current": {
"selected": false,
"text": "Prometheus",
"value": "Prometheus"
},
"hide": 0,
"includeAll": false,
"label": null,
"multi": false,
"name": "datasource",
"options": [],
"query": "prometheus",
"refresh": 1,
"regex": "",
"skipUrlSync": false,
"type": "datasource"
},
{
"auto": false,
"auto_count": 30,
"auto_min": "10s",
"current": {
"selected": false,
"text": "5s",
"value": "5s"
},
"hide": 0,
"label": null,
"name": "summarize",
"options": [
{
"selected": true,
"text": "5s",
"value": "5s"
},
{
"selected": false,
"text": "10s",
"value": "10s"
},
{
"selected": false,
"text": "30s",
"value": "30s"
},
{
"selected": false,
"text": "1m",
"value": "1m"
},
{
"selected": false,
"text": "10m",
"value": "10m"
},
{
"selected": false,
"text": "30m",
"value": "30m"
},
{
"selected": false,
"text": "1h",
"value": "1h"
},
{
"selected": false,
"text": "6h",
"value": "6h"
},
{
"selected": false,
"text": "12h",
"value": "12h"
},
{
"selected": false,
"text": "1d",
"value": "1d"
},
{
"selected": false,
"text": "7d",
"value": "7d"
},
{
"selected": false,
"text": "14d",
"value": "14d"
},
{
"selected": false,
"text": "30d",
"value": "30d"
}
],
"query": "5s,10s,30s,1m,10m,30m,1h,6h,12h,1d,7d,14d,30d",
"refresh": 2,
"skipUrlSync": false,
"type": "interval"
},
{
"allValue": null,
"current": {},
"datasource": "${DS_PROMETHEUS}",
"definition": "",
"hide": 0,
"includeAll": true,
"label": null,
"multi": true,
"name": "server",
"options": [],
"query": "label_values(server)",
"refresh": 1,
"regex": "",
"skipUrlSync": false,
"sort": 0,
"tagValuesQuery": "",
"tags": [],
"tagsQuery": "",
"type": "query",
"useTags": false
}
]
},
"time": {
"from": "now-5m",
"to": "now"
},
"timepicker": {
"refresh_intervals": [
"5s",
"10s",
"30s",
"1m",
"5m",
"15m",
"30m",
"1h",
"2h",
"1d"
],
"time_options": [
"5m",
"15m",
"1h",
"6h",
"12h",
"24h",
"2d",
"7d",
"30d"
]
},
"timezone": "browser",
"title": "App Metrics - Web Monitoring - Prometheus",
"uid": "U9LmHuWMk",
"version": 3
}
| Product | Versions Compatible and additional computed target framework versions. |
|---|---|
| .NET | net5.0 was computed. net5.0-windows was computed. net6.0 is compatible. net6.0-android was computed. net6.0-ios was computed. net6.0-maccatalyst was computed. net6.0-macos was computed. net6.0-tvos was computed. net6.0-windows was computed. net7.0 was computed. net7.0-android was computed. net7.0-ios was computed. net7.0-maccatalyst was computed. net7.0-macos was computed. net7.0-tvos was computed. net7.0-windows was computed. net8.0 was computed. net8.0-android was computed. net8.0-browser was computed. net8.0-ios was computed. net8.0-maccatalyst was computed. net8.0-macos was computed. net8.0-tvos was computed. net8.0-windows was computed. |
| .NET Core | netcoreapp3.1 is compatible. |
Compatible target framework(s)
Included target framework(s) (in package)
Learn more about Target Frameworks and .NET Standard.
-
.NETCoreApp 3.1
- App.Metrics.AspNetCore.All (>= 4.3.0)
- App.Metrics.Prometheus (>= 4.3.0)
- NetPro.Startup (>= 6.0.16)
-
net6.0
- App.Metrics.AspNetCore.All (>= 4.3.0)
- App.Metrics.Prometheus (>= 4.3.0)
- NetPro.Startup (>= 6.0.16)
NuGet packages
This package is not used by any NuGet packages.
GitHub repositories (1)
Showing the top 1 popular GitHub repositories that depend on NetPro.Prometheus:
| Repository | Stars |
|---|---|
|
LeonKou/NetPro
🌈An enhanced version with clean architecture of asp.netcore,efficiently manage startup,Support for netcore3.1/6.0
|